Creating the Artwork
Data Visualization
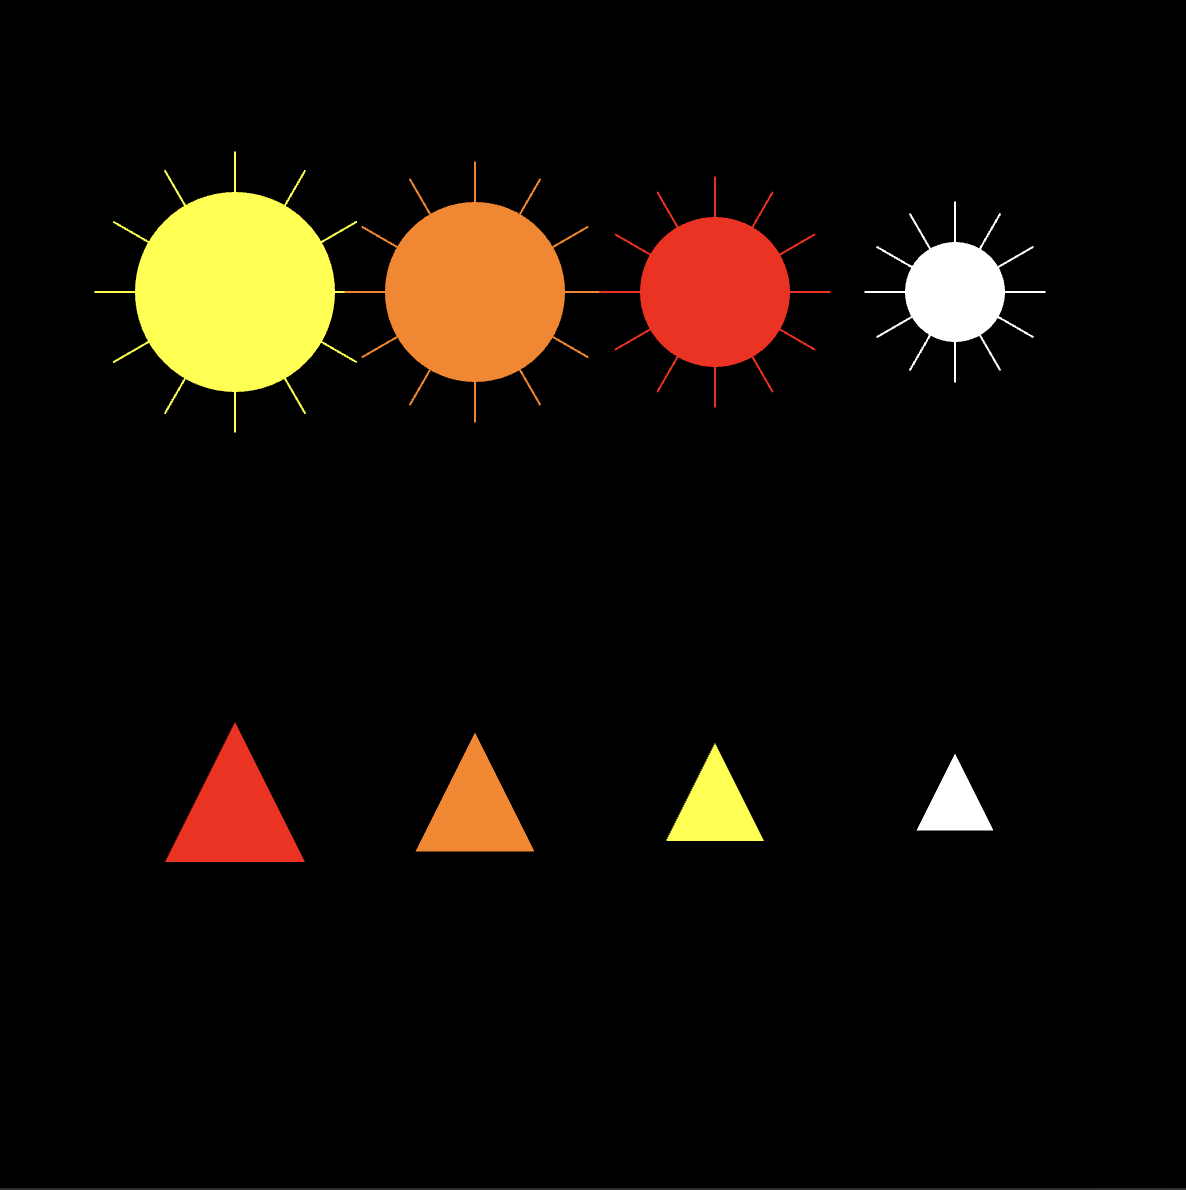
I chose to use suns and flames to visually represent the light and temperature data from my sensors. The size of each sun and flame corresponds directly to the respective data value, making it easy to compare the two datasets. Each color represents a different half-hour period, providing a clear and intuitive way to track trends and variations in both temperature and light over time.
//Temperature data is displayed as red vertical bars on the left half of the canvas, while light data is displayed as blue vertical bars on the right. The height of each bar corresponds to the respective data value.


let baselightURL = "https://io.adafruit.com/api/v2/michellecheng/feeds/photo-feed";
let basetempURL = "https://io.adafruit.com/api/v2/michellecheng/feeds/temp-feed";
let dataOption = "data";
let limitQuery = "limit=";
let includeQuery = "include=";
let tempValues = [];
let lightValues = [];

function setup() {
  createCanvas(800, 800);
  noStroke();

  // Fetch data every 5 seconds
  setInterval(() => {
    fetchTempData();
    fetchLightData();
  }, 5000);

  // Initial data fetch
  fetchTempData();
  fetchLightData();
}

function draw() {
  background(0); // Black background

  drawTemperatureGraph();
  drawLightGraph();
}

function drawTemperatureGraph() {
  let barWidth = (width / 2) / Math.max(tempValues.length, 1); // Width of each bar

  fill(255, 0, 0); // Red color for temperature
  for (let i = 0; i < tempValues.length; i++) {
    let x = i * barWidth; // Position of the bar
    let barHeight = map(tempValues[i], -20, 50, 0, height / 2); // Map temperature values to bar height
    rect(x, height / 2 - barHeight, barWidth - 2, barHeight); // Draw bar
  }
}

function drawLightGraph() {
  let barWidth = (width / 2) / Math.max(lightValues.length, 1); // Width of each bar

  fill(0, 0, 255); // Blue color for light
  for (let i = 0; i < lightValues.length; i++) {
    let x = width / 2 + i * barWidth; // Position of the bar
    let barHeight = map(lightValues[i], 0, 4095, 0, height / 2); // Map light values to bar height
    rect(x, height - barHeight, barWidth - 2, barHeight); // Draw bar
  }
}

async function fetchTempData() {
  try {
    let url = `${basetempURL}/${dataOption}?${limitQuery}10&${includeQuery}value`;
    let response = await fetch(url);

    if (!response.ok) {
      throw new Error(`HTTP error! status: ${response.status}`);
    }

    let data = await response.json();
    console.log("Raw temperature data:", data); // Log raw response

    tempValues = data.map((d) => parseFloat(d.value) || 0);
    console.log("Processed temperature values:", tempValues); // Log processed values
  } catch (error) {
    console.error("Error fetching temperature data:", error);
  }
}

async function fetchLightData() {
  try {
    let url = `${baselightURL}/${dataOption}?${limitQuery}10&${includeQuery}value`;
    let response = await fetch(url);

    if (!response.ok) {
      throw new Error(`HTTP error! status: ${response.status}`);
    }

    let data = await response.json();
    console.log("Raw light data:", data); // Log raw response

    lightValues = data.map((d) => parseFloat(d.value) || 0);
    console.log("Processed light values:", lightValues); // Log processed values
  } catch (error) {
    console.error("Error fetching light data:", error);
  }
}


